
More than 80% of content on the internet is video. But despite its popularity, the mechanics of building video into app experiences (along with related metrics) remains challenging for developers.
If the extent of your familiarity with video is uploading to YouTube or a service provider like Vimeo, your first experience trying to bring video natively into your website, web application, or mobile app will present layers of UX considerations as you think about the video viewing experience. Just like with any other front-end experience, people have short attention spans, and the video user experience is “make or break” for your video assets.
A noob’s journey into video user experience
There are all sorts of nuances to how video renders, how it looks on different devices, how the app and video infrastructure handle peak usage, native apps vs. mobile web, and many other considerations. The further you get into it, the more you will want some solid data to understand what is actually going on with your video at scale, in the wild. If we can turn to tools like Fathom or Google Analytics for site traffic and visitor behavior, and Lighthouse performance scoring for web page performance metrics like first contentful paint and time to interactive, then where can we turn for the equivalent metrics we should care about for optimizing video user experience for our sites and applications?
When you’re starting to build a new app, you dream about people finding it and getting value out of it, and who knows, maybe usage grows and you have a mega-success on your hands. At each step of the way, you as a developer have different needs when it comes to the kind of infrastructure you need to scale the app, and different data points that you need to understand user engagement and how to improve your offering. Video has that same sort of trajectory, where those simple user engagement questions you have at the beginning evolve as you experience real traction and scale with your video assets.
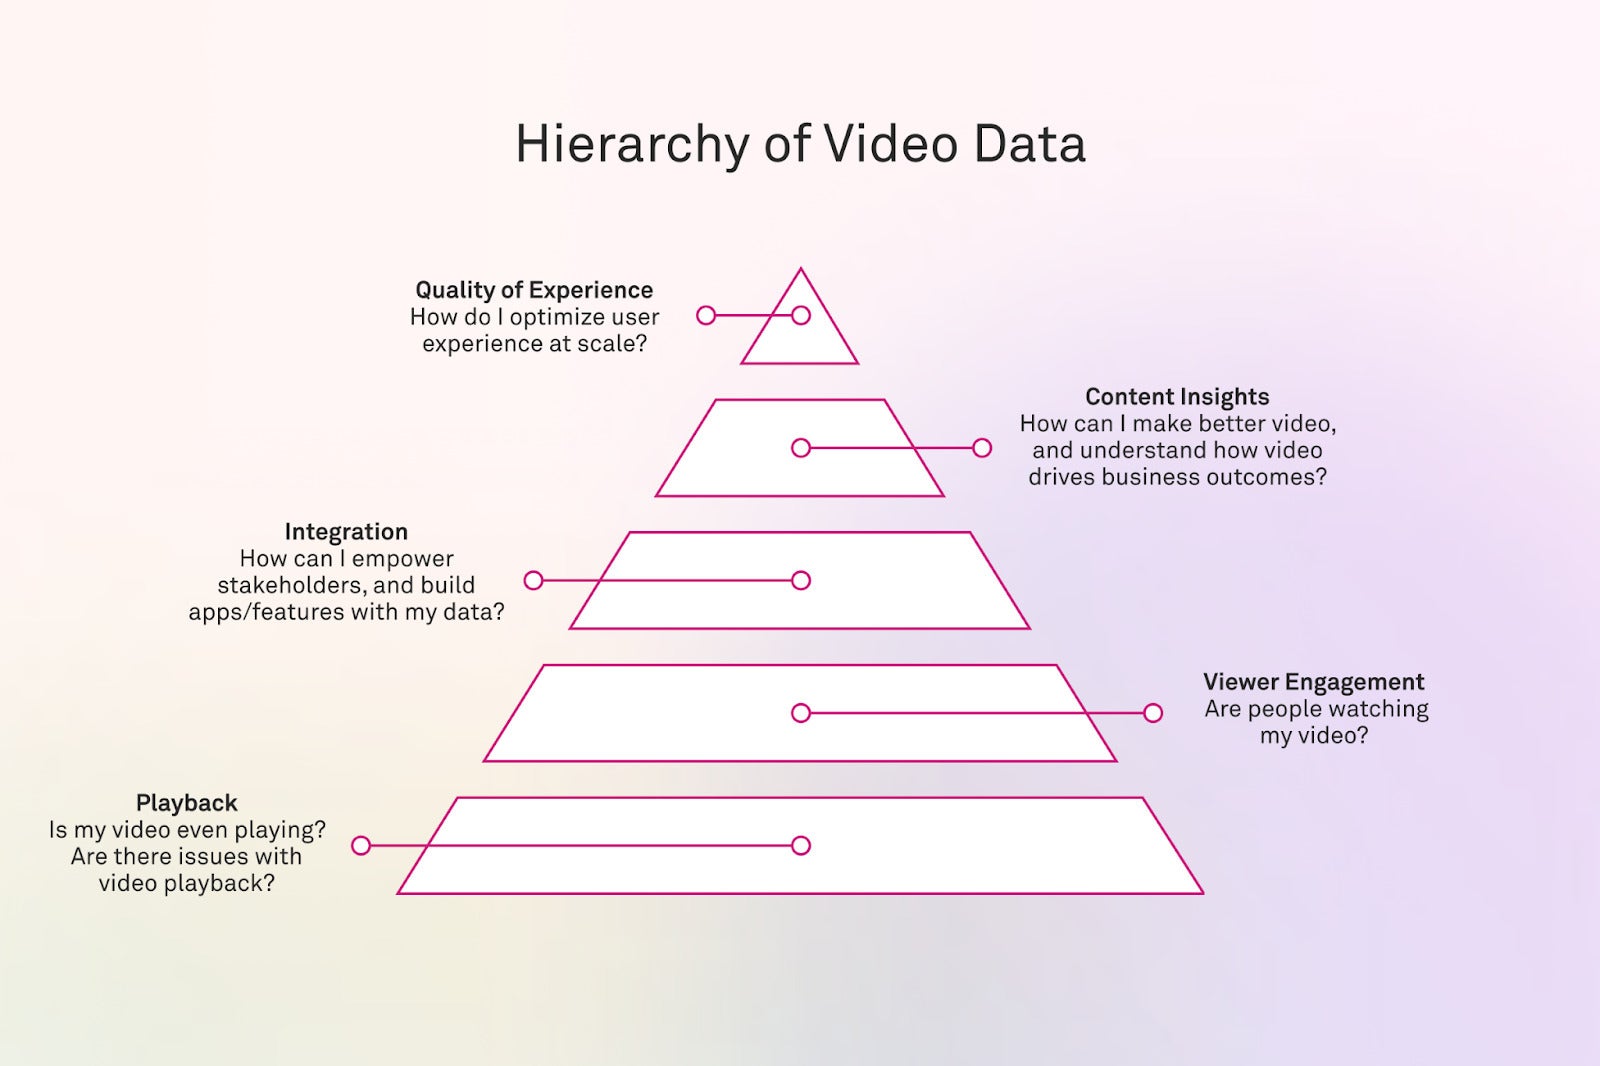
So let’s consider the “video data hierarchy of needs” (with due credit to Dr. Maslow), outlining the type of data you need when you launch an app, all the way up to the pinnacle, when you can invest in fine-tuning your video operation to optimize the user experience.
 Mux
MuxPlayback
Before you invest in scaling and optimizing your video platform, you’ll first want to understand whether your videos are even playing back correctly. This is critical data to understand. If viewers encounter a bad experience in the first moments of encountering a video and hitting play, there’s no hope for keeping them around.
The primary thing that you’ll want to pay attention to is simple: Are your videos playing? You’ve got your player and video lined up, but if there’s a kink in the video pipeline for live video, your users hit play and there’s a long delay to start, or worse, nothing happens—that’s bad. And there are a multitude of things that could go wrong with playback:
- An issue broadcasting your live stream from your origin device
- An upgraded player your video isn’t supporting
- New JavaScript on a page that isn’t working properly
- An upgraded browser that’s not supported
- Expired SSL certificate issues
- A bad URL redirect
- Different experiences across browsers and devices
Asking these key questions will help you understand video playback:
- Did your video start for viewers?
- How long did it take to start?
- Did the video start without an error?
- In the case of live video, did your video make it through the encoding pipeline through delivery?
- Did the user actually get to playback, or did they exit before playback started?
- How many views are your videos racking up?
Viewer engagement
The next step is understanding basic metrics about viewer engagement. If you’re putting video out into the world, you need to understand whether people are watching them, and start to understand what types of video are most popular.
Some things that you’ll want to track include:
- Video starts
- Unique viewers
- Playing time
These metrics are valuable to companies and teams of all sizes, from developers monitoring their services, to product owners trying to understand the success of their product, to marketing teams needing detailed usage data. There are a variety of ways these metrics can be helpful. For example:
- KPI metrics: Track how many users you have this month vs. previous months and measure your success over time.
- Capacity planning: Measure how many views you are actually serving for your events to ensure you have the server resources to meet demand.
- Maintenance: Provide a quantitative measure of low traffic and high traffic periods to ops teams so they can determine when platforms can be taken offline for maintenance.
Observability
For companies where the stakes are higher with video—say, where the video is the product, or it’s a critical touchpoint for a high volume of customers—now you start to experience a demand for the type of sharing and team collaboration requirements that you see in mature products and functions (like devops, for example). Here’s what those considerations start to look like:
- Information sharing starts small and informal—taking screenshots, sticking data in PowerPoint or email, and CSV exports. But this quickly evolves from the domain of a single business or technical stakeholder, and starts informing other parts of the business, like operations teams, marketing, customer service, and finance.
- On the cost side of things, stakeholders such as finance and product organizations will want more information that ties video viewing to specific costs, such as encoding and CDN. This will help with cost management, but requires additional reporting.
- Eventually you will need to operationalize data collection, sharing, and analysis. The need for higher level insights into the data will push you towards observability tools like Grafana, New Relic, or Datadog, systems for operational reporting, and even ingesting data into data lakes for additional processing and analysis.
This integration layer will be driven by higher level questions into the data, as video becomes a bigger part of your business and the product experiences you deliver to your customers.
Content insights
As we climb higher up the hierarchy, we get into the realm of businesses that are heavily invested in video and using content to drive business outcomes. Video is expensive to create and deliver, and companies significantly invested in video will want better data on what people are watching and what’s performing well, so they can tune their video production priorities accordingly. This echelon involves the following, for example:
- Deeper analysis of viewing behavior within a piece of content. Seeing which videos are played is one thing, but more granular data on what viewers are doing during a viewing session yields video completion percentage, allows you to construct heat maps of engagement within the video, and more.
- Conversion rate tracking. If you are an ecommerce or retail company that is bringing video close to the point of sale, you care very much about correlating video playback data with your sales conversion KPIs.
- Expanding beyond views to unique viewers, and to new users vs. returning users.
Quality of experience (QoE)
At the top of the hierarchy of needs are the truly thorny concerns for video experience. This is where streaming providers with millions of viewers have video engineering teams that dig into the most granular optimizations to make improvements that can have massive impact at scale, and propel the business forward.
“Quality of experience” is a codified standard that describes the video experience from the viewers’ PoV. It includes things like:
- Video stalls: How broadly viewers are experiencing videos stalling across your videos, platforms, geographies, or networks.
- Responsiveness: How responsive is video playback across the different devices, different locations, different CDNs, different ISPs, and different video formats (HLS, Dash, etc.) you support.
- Failure handling: How to approach buffering, playback failures, and other strategies so that a user won’t experience any issues from a two-second internet outage.
The video UX haves vs. the have-nots
In industries like fitness, ecommerce, and retail, more and more companies are bringing on-demand, live video and even real-time video directly into their products, websites, and mobile apps. We’re all familiar with the most obvious examples like Peloton, but we can expect to see more video popping up in online product catalogs (“live shopping” experiences) and in sales interactions (speak directly with customer service via live video rather than launching a separate Zoom meeting). Expect more companies to make use of user-uploaded video (to increase app and community engagement) as well.
For some businesses, this push to video is so central to their product evolution that one-percent QoE optimizations are a worthy pursuit. For smaller companies just getting their feet wet with native video, understanding the basics of engagement and playback performance may be all they ever need.
But I think one thing’s for certain: Video will become increasingly familiar to website and application developers, and it’s only a matter of time before you are going to find yourself trying to figure out which optimizations on the hierarchy you should be spending the most time on.
Steve Lyons is a director of product management at Mux, a video infrastructure platform for developers.
Copyright © 2023 IDG Communications, Inc.